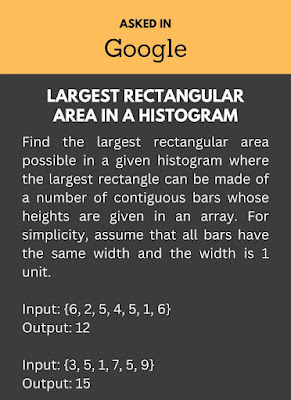
Find the largest rectangular area possible in a given histogram where the largest rectangle can be made of a number of contiguous bars whose heights are given in an array. For simplicity, assume that all bars have the same width and the width is 1 unit.
Cpp Program Code:
Here's the C++ code to find the largest rectangular area in a given histogram:
The largestRectangleArea() function takes a vector of integers heights as input and returns the largest rectangular area possible in the given histogram. We use a stack to keep track of the bars whose heights are being considered for calculating the maximum area.
In the first while loop, we keep pushing the index of each bar into the stack until we find a bar whose height is less than the height of the bar at the top of the stack. At that point, we pop the top bar and calculate the area using the height of the popped bar and the distance between the current bar and the previous bar in the stack. We update the maximum area if the calculated area is greater than the current maximum area.
Once we have processed all the bars in the histogram, we pop the remaining bars from the stack and calculate the areas using the same formula as before.
Finally, we return the maximum area calculated throughout the process.
Python Program code:
Here's the Python code to find the largest rectangular area in a given histogram:
The function largest_rectangle_area takes an array histogram as input and returns the largest rectangular area possible in the given histogram. It uses a stack to keep track of the indices of bars in the histogram, and calculates the area of the rectangle formed by each bar and the bars to its left and right. The maximum of these areas is returned as the result.

.png)

.png)